Course: Tools for debugging VHDL designs
FPGA projects are challenging to debug, and that’s because it’s hard to understand what’s going on in the design. But once we gain insight and see the complete picture, problems often melt away.
Description
FPGA projects are challenging to debug, and that’s because it’s hard to understand what’s going on in the design. But once we gain insight and see the complete picture, problems often melt away.
That’s why I’ve created this course with lots of techniques you can use to debug your VHDL project in the simulator and the lab.
In this course, you will learn to use helpful features in the Questa simulator, like viewing delta cycles in the waveform and stepping through VHDL code in the debugger.
You will also see how to do post-synthesis of Intel designs using Quartus/Questa and post-synthesis and implementation simulations in Xilinx Vivado.
Furthermore, we explore the tools we have for debugging in the lab when the FPGA design doesn’t work as expected. We will use the Signal Tap logic analyzer in Intel Quartus and the Integrated Logic Analyzer (ILA) in Vivado to capture signal values inside the FPGA.
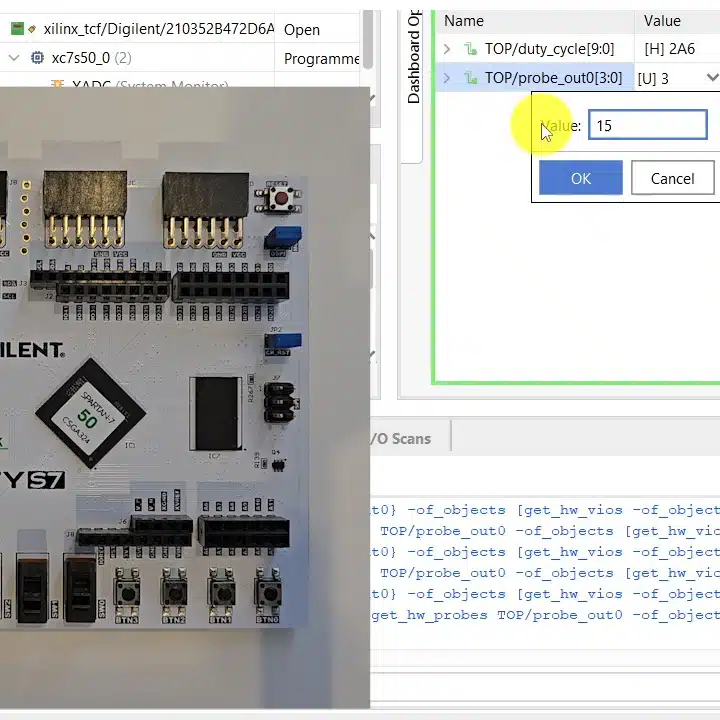
Finally, we use Xilinx’s Virtual Input/Output (VIO) core to interact with the design in real-time while running on the FPGA.
This course is only available in the VHDLwhiz Membership.
The membership subscription gives you access to this and many other courses and VHDL resources.
You pay monthly to access the membership and can cancel the automatic renewal anytime. There is no lock-in period or hidden fees.
Hardware used in the course
- Arty S7-50: Xilinx Spartan-7 FPGA (SKU: 410-352)
Resellers: Digilent, Farnell, Newark, Mouser, DigiKey - Terasic DE10-Lite: Intel MAX 10 FPGA (SKU: P0466)
Resellers: Terasic, Mouser, DigiKey - (You can use any Xilinx or Intel board)
Software used in the course
I am using Windows 11 in the course. All the other software is available for free for Windows and Linux:
- Questa – Intel FPGA Edition(includes Starter Edition)
(Any version of ModelSim or QuestaSim will work) - Xilinx Vivado
- Intel Quartus Prime Lite Edition
- Microsoft Visual Studio Code
(Any editor will do)
Course outline
The overview below shows the lessons in this course.

1 - Introduction
Why is debugging VHDL designs so challenging?

2 - Simulating the demo project in Questa
I've chosen this VHDL project as our course's working material.

3 - Questa's waveform viewer and advanced debugging features
Let's check out some tools you can use to debug VHDL projects in the simulator.

4 - Implementing the design in Intel Quartus Prime
This walkthrough shows how to implement the demo design on the Terasic DE10-Lite board.

5 - Post-synthesis simulation in Quartus/Questa
After implementing the design in Intel Quartus Prime, we can export the synthesized netlist and simulate it as a VHDL module in Questa.

6 - Using the Signal Tap logic analyzer in Quartus
The built-in logic analyzer lets you capture internal signals in the FPGA while it is running.

7 - Implementing the design in Xilinx Vivado
In this lesson, we'll implement the demo design on the Digilent Arty S7-50 board.

8 - Post-synthesis and implementation simulation in Vivado
Let's perform a timing simulation on our Xilinx Spartan 7 design.

9 - Using the Integrated Logic Analyzer (ILA) in Vivado
Vivado's built-in logic analyzer is a versatile tool for debugging FPGAs in the lab.

10 - Using Xilinx's Virtual Input/Output (VIO) core
This tool lets you interact with your design and monitor signal values in real-time while it is running on the FPGA.
This course is only available in the VHDLwhiz Membership.
The membership subscription gives you access to this and many other courses and VHDL resources.
You pay monthly to access the membership and can cancel the automatic renewal anytime. There is no lock-in period or hidden fees.


Reviews
There are no reviews yet.