As most hardware engineers, I started off my computer science career by learning a sequential programming language. The first language I learned at the University of Oslo was Java. While it’s not considered to be the most exciting language today, at the time, Java was at the pinnacle of its popularity.
The engineers who built Java were trying to solve a number of issues which earlier languages were lacking in one blow. Perhaps a wise decision to do a fresh start instead of continuing down the C path and creating C+++. The virtual machine, built-in garbage collection, and the separate null pointer were all significant improvements that have saved countless of debugging hours over the years.
Along with Java, a multiverse of frameworks and tools supporting the new programming language came into existence. One of them was JUnit, Java’s de-facto unit testing framework.
Testing is optional in software
While I was taught to use JUnit early in my education, I must admit that I have actually used it very seldom. And the same goes for testing frameworks for other programming languages, for example Python’s unittest. I know how it works, and I have used it, but most of the time I don’t bother with testing at all.
If the program you are creating is anything less than an enterprise solution, it’s simply not worth the time and effort to create tests for all classes and functions. It’s much easier to just throw it against the wall and see what sticks.
You will get notified when there is a problem. Perhaps by a nice, readable stack trace which will help you pinpoint the root cause. Or maybe you will see that the output from the program is gibberish. Of course, the latter requiring a bit more effort to debug.
The point being, in software, you can always try and try until you get it right. This is not the case with VHDL. The reality is that in VHDL you can create what you can test. If you can create a complex module, but you are unable test it, then it won’t work. I guarantee it.
There is no printf in hardware
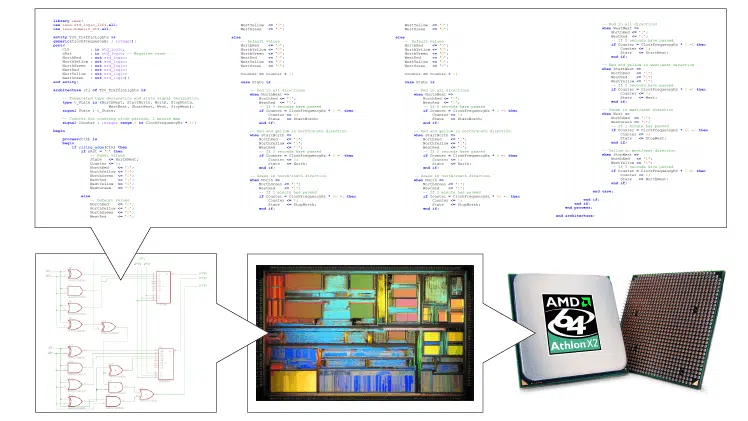
The product of VHDL is a digital circuit which runs on real hardware, inside of an FPGA or ASIC. Consequently, it’s not easy to get insight of what’s going on inside of the chip when stuff isn’t working. There is no stack trace to give you any clues about what went wrong. The only thing you see is the dark, silent chip, which isn’t working.
While I am a profound user of printf debugging myself in software, I would strongly discourage this kind of approach when it comes to hardware.
There is no console natively attached to an FPGA, but you can still get output from it via UART or Ethernet. Many large-scale FPGA designs are created with built-in messaging networks. But it comes at a cost. Extra resources will be consumed for each and every value that is monitored. Also, the sampling won’t happen at clock frequency. The interfaces are far too slow for that.
Toggling LEDs to indicate error conditions is a popular way see what’s going on inside of the chip. However, LEDs are most wisely used for alerting about errors on external interfaces, rather than as a general-purpose debugging tool.
But what about ChipScope?
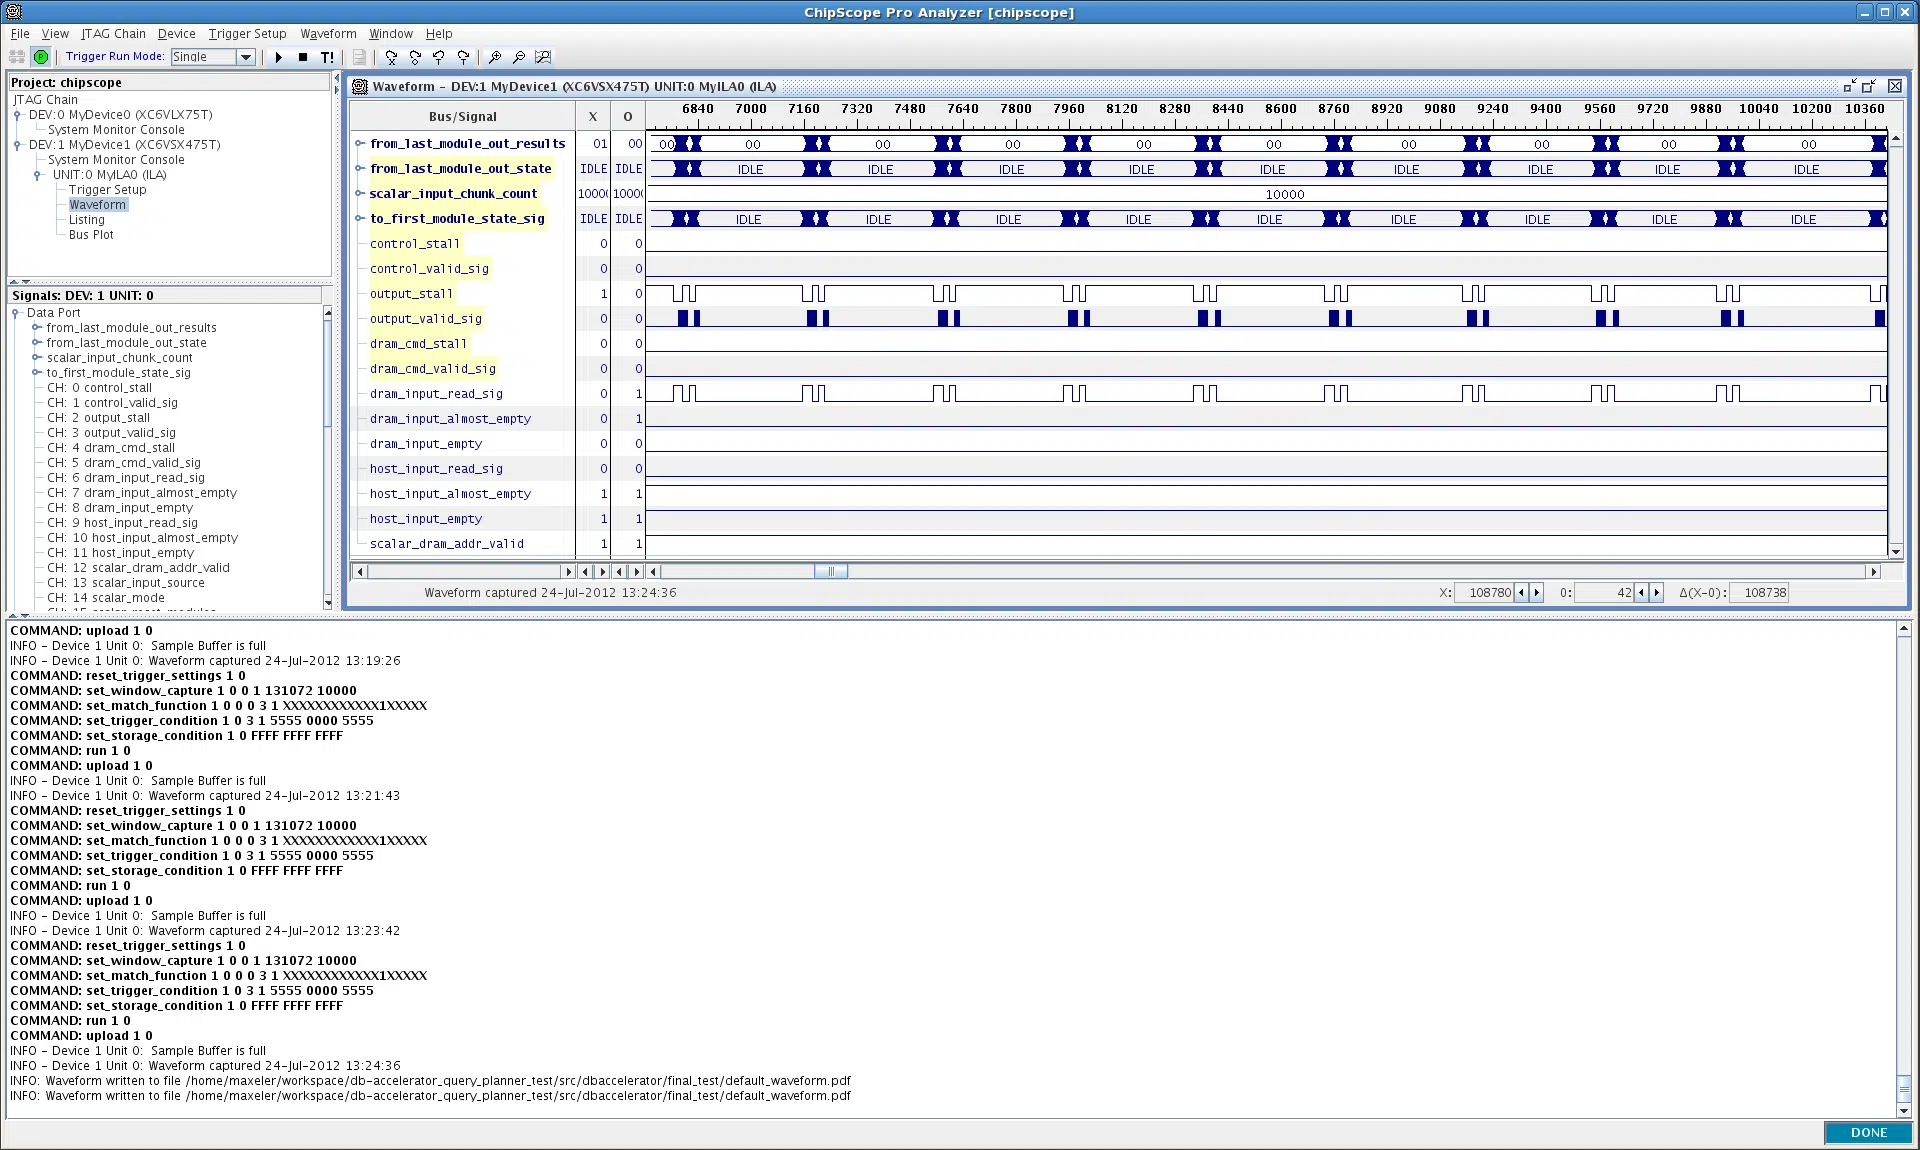
Another way to gain access to signals inside of an FPGA is by inserting logic analyzers into the design. Xilinx’ ChipScope Pro and Altera’s SignalTap are examples of such tool kits. The captured data can be transferred via JTAG to a computer, where it can be viewed in a regular waveform viewer.
But you might be shooting yourself in the foot if you start to rely on this kind of debugging.
First of all, it’s very time consuming. Every time you want to tap a different signal, a reroute is required, which can take hours for a medium sized FPGA design. With Java, I could change the code, recompile and run the program four times within a minute. This could easily mean the whole workday for an FPGA engineer. Perhaps a good solution if you’re paid by the hour ?.
Secondly, when you fix one thing, you may break another, maybe without even knowing it before it’s too late and the chip is in production. Ideally, VHDL modules should be entirely self-contained, with a clearly defined external interface. In reality, this is not always the case.
When you change something in one module, you may break the interface to the next one. Without any form of regression testing, this will be hard to detect. You will be stuck in an eternal loop of always fixing things as they break.
ChipScope changes the routing
And finally, when you add debugging logic, you are changing the circuit. If your problem is not a logical error, but rather has something to do with the timing constraints, you may not even find the answer.
When a temporary debug module is added to the design, you are moving stuff around physically on the chip, and the error may even magically go away because the routing has changed, and the timing violation isn’t there anymore. I have even heard rumors about FPGAs being sent to production with ChipScope cores in them, because that was the only time they worked properly.
Clearly, these are not situations you want to be in. This kind of debugging is best used as a last resort, when the simulation for some reason differs from the implementation.
Verification rock stars
When I was a newly graduate with a fresh master’s degree in FPGA design, I wanted really badly to become a chip designer. That is, I wanted to be the one writing the RTL modules, and not part of the verification team. I had these feelings because I didn’t fully understand the process of hardware design, and the importance of testing and verification.
It’s always more difficult to make the testbench than it is to make the device under test (DUT). If done properly, the testbench must test all the possible input sequences and verify that the output from the DUT is correct. Inherently, the testbench in most cases actually must contain an implementation of the DUT. Usually, this is in the form of a bus functional module (BFM), a VHDL module written using non-synthesizable code.
Therefore, after being several years in the industry, I would be just as open to a role in the verification team as in the design team. It’s neither a dull nor an easy job. Coming up with clever ways of testing every imaginable corner case requires a certain degree of creativity. A job that fits the bill if you have that sort of mind.
The Self-checking testbench
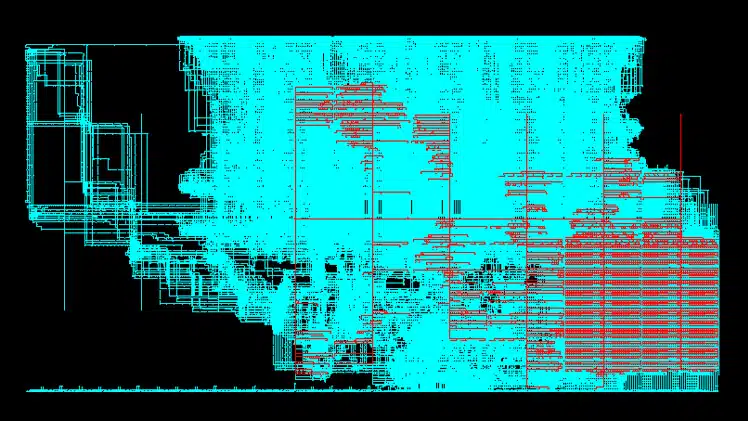
While waveforms are nice in the beginning, and useful for debugging, they are not enough in the long run. The waveforms are not going to help you when you a few weeks or months down the line make changes to one of the sub-modules. You may have forgotten the details of the DUT, and just by looking at the waveform, it will be difficult to tell if the module is still working or not.
What you always want to create for every module in your design, is a self-checking testbench. This kind of testbench is designed to run in batch mode, and doesn’t rely on your expert opinion to determine if the DUT passes the tests or not. Much like how JUnit works in Java, the self-checking testbench will print out an “OK” or “Failed” in the end.

Most self-checking testbenches follow this basic pattern. Inputs are generated and simultaneously fed to the DUT and a reference module (BFM). Outputs from the two are then compared to determine if it’s a pass or a fail.
Regression testing
With a self-checking testbench present for each and every design element, you can create a regression test which tests the whole design whenever something has to be changed. The regression test is simply a script that runs all the testbenches and prints a fail or pass message at the end.
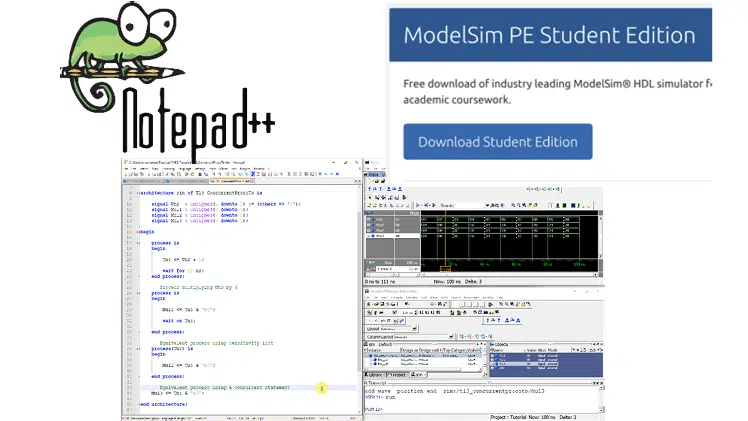
Example output from ModelSim after running a regression test in my upcoming Dot Matrix LED Controller FPGA course:
# ** Regression test completed **
#
# char_buf: OK
# char_fifo: OK
# char_rom: OK
# led_controller_8x8: OK
# reset: OK
# top: OK
# uart: OK
#
# Regression test: OK
Regression tests can be created using ‘make’ and shell scripts in a pure command line environment. Or they can be created by using TCL if it is intended to be run from within the GUI environment of a VHDL simulator like ModelSim.
Getting started with testbenches
Now is the time to become serious about testing, if you are not already. The testbench isn’t a choice nor is it a necessary evil. The quality of your verification regime is what ultimately sets the boundaries for how successful your designs will be.
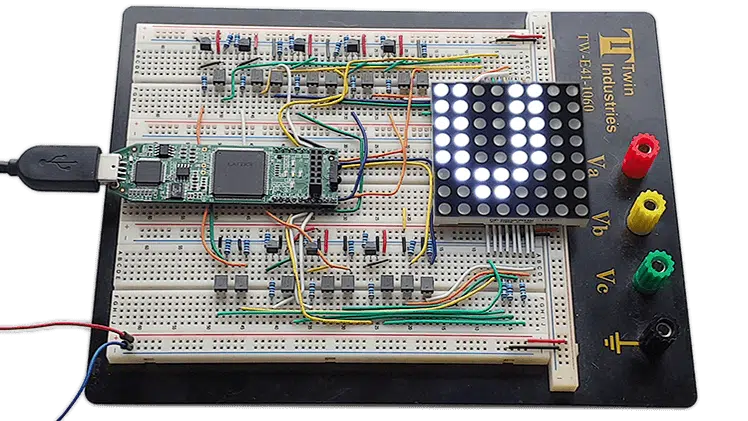
I am *creating a new VHDL course which will teach you how to design FPGAs from scratch. In this course I will walk you through the process from the drawing board, through simulation, to the implemented design.
Updated 12th of October 2020: I have completed the course. Click the image below to learn more.
You will learn how to partition your design, and create testbenches using the strategies that were talked about in this article.
Very nice write-up.
I just wanted to share my thoughts: I find writing a testbench is very helpful during the design process of a module. Often, the requirements for a module are very vague, and it is not clear at all exactly what a module should do. But instead of rushing forward with an implementation, which most likely will have to be modified again later, I start with the testbench. Because writing the testbench asks the important questions: “What EXACTLY is this module supposed to do?” and “HOW do I use this module?”. Answering these questions is vital to the success of the design.
Furthermore, while writing the testbench (before doing the actual design) it becomes clear whether the module interface is working appropriately. For instance, while transferring data into or out of the module, is there any flow control? Should there be? Can there be? How does it work?
So in my experience, designing the interface to a module is something I do simultaneously with writing a testbench. This is somewhat similar to writing the API of a software library: It’s important to consider how the library / module is to be used.
Those are interesting points you are raising.
I guess the ideal design flow is to start with the specification, write the testbench from it, and finally, the module. This picture fits nicely on a Powerpoint slide, but it’s often hard to achieve in practice.
Thanks for the insightful comment!